雅思小作文动态图
阅读量:
对于仍在备考雅思的同学来说,要想考出高分,还需要进一步了解考情、找准技巧!
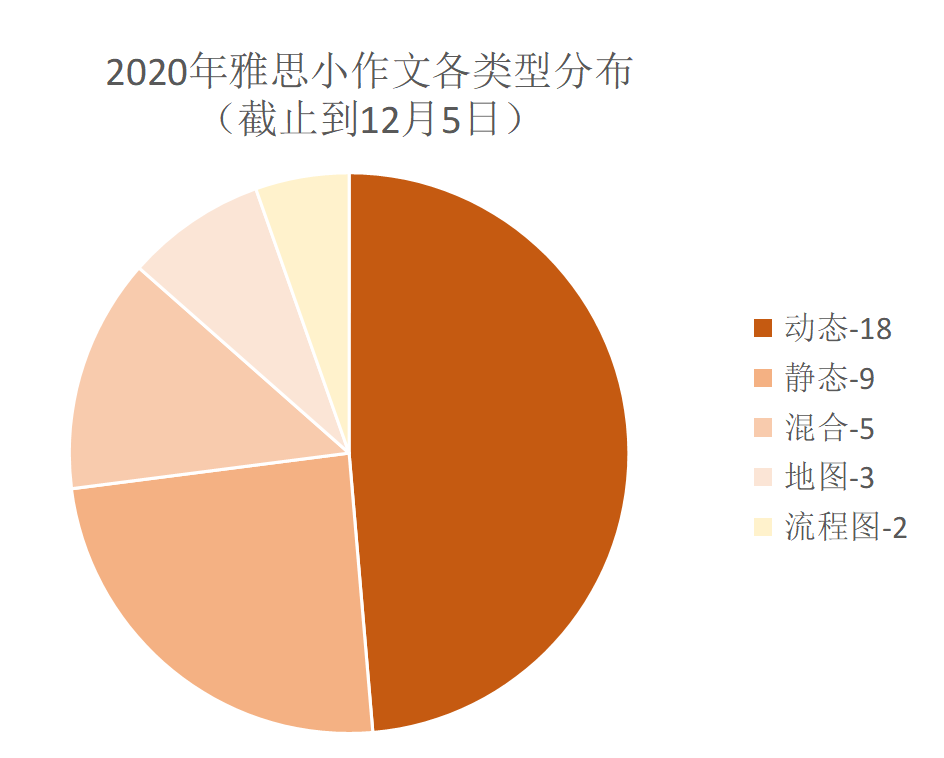
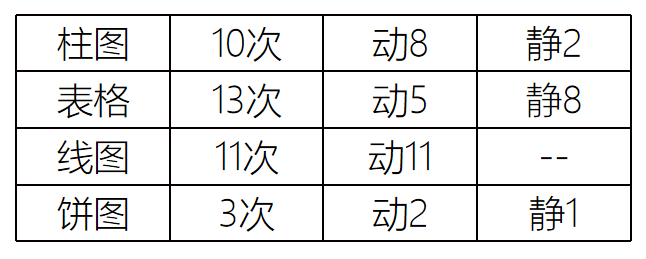
在今年的雅思考试中,动态图以压倒性的数量(18场 <不含混合图表>)稳居题型榜首,每个月的考查频率不少于两次。而算上混合图,动态柱图出现了8次,动态表格出现了5次,动态饼图出现了2次,线图出现了11次。静态图共出现9场,其中静态饼图出现了1次,静态柱图出现了2次,静态表格出现了8次。


作为很多考生眼中出现频率、最简单的题型动态图在考试中却很难取得高分,接下来,就让雅思写作组秦兵兵老师教大家。
遇上小作文动态图,如何写出高分?
动态图即图中包括两个或两个以上时间点的题目,包括线图、饼图、表格、柱图四种图形。无论是哪种图形,动态的本质都是描述趋势变化,所以写作要点是相通的:
1. 内容分段要合理,信息筛选要准确;
2. 用词要准确;
3. 包含一定数量复杂句式。

01.内容分段与信息筛选
按照趋势特征分类,所有的动态图可分成两大类:
一种是图中内容趋势相似(例如整体全部上升或下降);另一种是图中内容有不同趋势(例如有上升,有下降,有平稳,有波动)。
因此,动态图的主体分段方法也有两种:
❶ 当图中内容趋势相似时,按幅度大小分段,即变化显著的分一段,不显著的分一段;
❷ 当图中内容趋势不同时,按趋势类型分段,即趋势相似的分一段,趋势不同的另成一段;
动态图写作时,只需要把图中的主要趋势和主要数据描述出来即可,切记不要像流水账一样把所有数据列出来。一般来说,重要的数据包括起点值、重要转折点值(包括值、最小值、交叉点)、终点值。
对于表格、饼图、柱图这种趋势不明显的图形来说,考生只需要把同一个项目的不同时间点的数据连在一起即可得到一条线图,这样趋势变化就明显很多。如果一个项目的整体呈上升趋势,那么中间的那些过渡值可以省略,只需要描写出其趋势变化(例如显著上升或轻微增长)以及起点值和终点值即可。
02.词汇的准确度
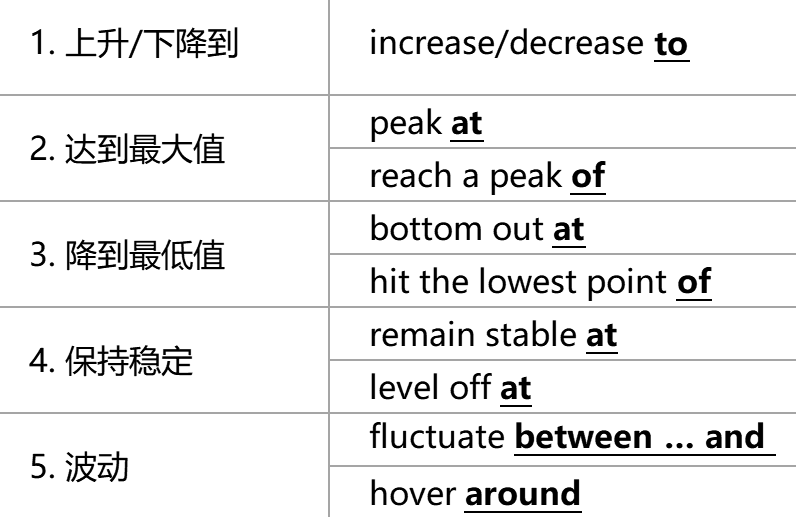
动态图写作最常用的词汇是表趋势变化的动词,如:
上升:increase, rise, grow;
下降:decrease, decline,fall;
平稳:remain stable, level off;
波动:fluctuate between … and…, hover around
而在动态图写作中,考生常犯的错误包括:
❶ 动词过去式、过去分词形式错误,特别是一些不规则的动词形式;
❷ 双谓语(如was increase)或被动语态(was increased),切记所有的趋势变化类动词均使用主动语态。
❸ 除此之外,趋势变化的名词也常出现在动态图写作中,例如上升:an increase,a rise,a growth;下降:a decrease,a decline,a fall,使用这类名词时考生常犯的错误是中式表达(例如… had a significant increase),正确的表达是:There was a significant increase in …
介词也是困扰一部分考生的问题,需要牢记各种介词固定搭配,见下表


03.复杂句式
很多考生在写作文时,会绞尽脑汁使用很多衔接词/短语,例如however,then,on the contrary,after that等,不可否认衔接词能把内容有逻辑地组织在一起,但是过多使用这类词会导致绝大部分句子都是简单句,这是通往高分之路的重要障碍之一。
有效的改进方式是:尽量将两个变化趋势用复杂句式连在一起,这样一来既可以避免衔接词重复也可以提升句子的难度。

今天给大家介绍4个可以把两个趋势变化连在一起的句式,例如:
在2001-2005年间,每杯咖啡的价格稳定在$4,之后价格开始骤增,在2010年达到值$8。
A cup of coffee was sold at $4 between 2001 and 2005, after which the price increased significantly and peaked at $8 in 2010.
The price of a cup of coffee was $4 between 2001 and 2005, followed by a significant increase to $8 by 2010.
Despite remaining stable at $4 between 2001 and 2005, the price of a cup of coffee then increased significantly and peaked at $8 in 2010.
Having remained stable at $4 in the first five years, the price of a cup of coffee then increased significantly and peaked at $8 in 2010.
04.写作考题举例及参考表达
下面以新航道第七代基础写作教材中的一道题目为例,分析上述写作要点。
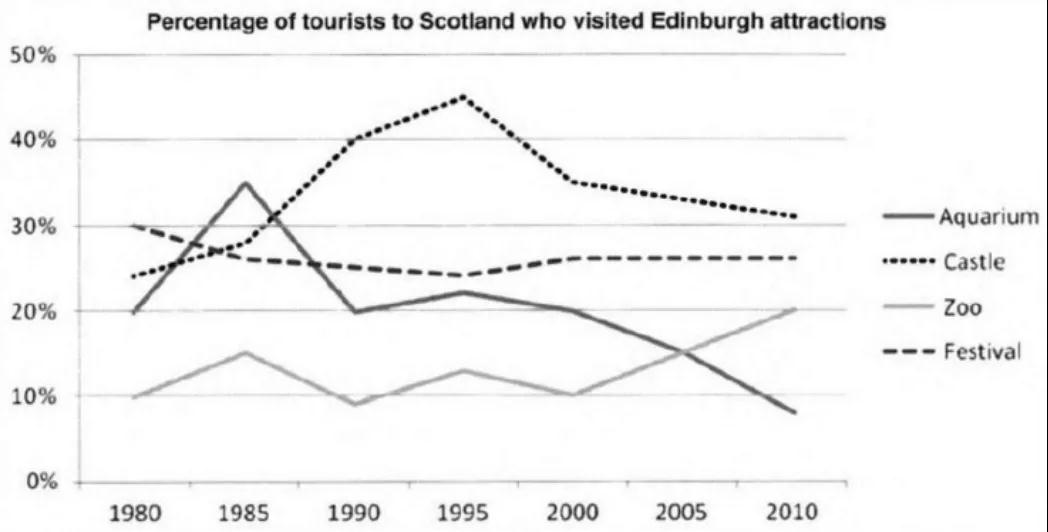
The graph below shows the number of visitors to three museums between 2000 and 2005.
Summarise the information by selecting and reporting the main features, and make comparisons where relevant.

答题思路解析
❶ 图中有四条线,其中castle和aquarium这两条线都是先上升后下降的趋势,zoo这条线是波动后上升,festival这条线轻微下降后基本稳定。因此,趋势相似的castle和aquarium这两条线写一段,其余两条写一段;
❷ castle和aquarium这两条线重要数据是起点值、转折点值和终点值;zoo这条线重要数据是波动范围值和终点值;festival这条线重要数据是平稳的数值。
参考例文
*注:橙字是词汇,粗体下划线是连接两个趋势的句式
The graph illustrates changes in the proportion of people who visited four tourist spots in Edinburgh of Scotland between 1980 and 2010.
The percentage of visitors to the castle increased significantly from about 25% in 1980 to 45% in 1995, after which it decreased slightly and ended at around 31% in 2010. Similarly, the percentage of visitors to the aquarium rose sharply in the first five years from 20% to approximately 35%, followed bya dramatic fall to less than 10% by 2010.
With respect to the visitors to the zoo, having fluctuated between 9% and 15% during the first two decades, the proportion then grew steadily and reached 20% in 2010. If we look at the figure for festival, despite declining marginally between 1980 and 1985, it levelled off at 25% until 2010.
Overall, there was a downward trend in the popularity of the castle and the aquarium, while that of the festival and the zoo did not changed significantly. Besides, it is noticeable that in 1980 the festival was the most popular but in 2010 more visitors preferred the aquarium.
更多关于雅思考试的个性化问题敬请咨询新航道官网
